High Risk Stocks Based on Data Mining: Returns up to 171.43% in 1 Month
High Risk Stocks
This forecast is part of the Risk-Conscious Package, as one of I Know First’s equity research solutions. We determine our aggressive stock picks by screening our algorithm daily for higher volatility stocks that present greater opportunities but are also riskier. The full Risk-Conscious Package includes a daily forecast for a total of 40 stocks divided into four main categories:
- Top 10 Aggressive stocks for the long position
- Top 10 Aggressive stocks for the short position
- Top 10 Conservative stocks for the long position
- Top 10 Conservative stocks for the short position

Package Name: Aggressive Stocks Forecast
Recommended Positions: Long
Forecast Length: 1 Month (5/15/2020 – 6/16/2020)
I Know First Average: 78.37%

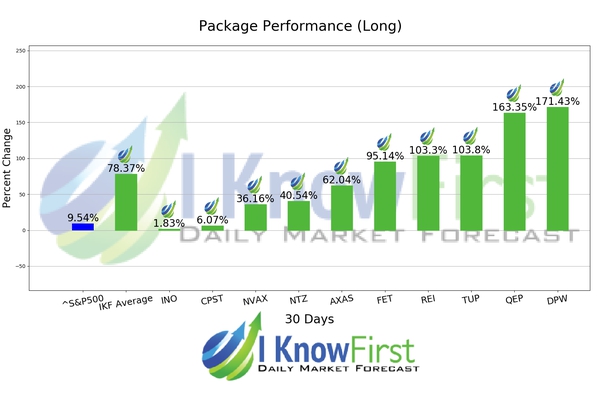
This Aggressive Stocks Forecast Package forecast had correctly predicted 10 out of 10 stock movements. The top performing prediction from this package was DPW with a return of 171.43%. QEP and TUP saw outstanding returns of 163.35% and 103.8%. The package saw an overall yield of 78.37% versus the S&P 500’s return of 9.54% implying a market premium of 68.83%.
Digital Power Corporation (DPW) designs, develops, manufactures, and sells power system solutions for the medical, military, telecom, and industrial markets in North America and Europe. The company offers custom power system solutions; high-grade flexibility series power supply products, such as power rectifiers; and value-added services for original equipment. manufacturers.
Algorithmic traders utilize these daily forecasts by the I Know First market prediction system as a tool to enhance portfolio performance, verify their own analysis and act on market opportunities faster. This forecast was sent to current I Know First subscribers.
How to interpret this diagram
Algorithmic Stock Forecast: The table on the left is a stock forecast produced by I Know First’s algorithm. Each day, subscribers receive forecasts for six different time horizons. Note that the top 10 stocks in the 1-month forecast may be different than those in the 1-year forecast. In the included table, only the relevant stocks have been included. The boxes are arranged according to their respective signal and predictability values (see below for detailed definitions). A green box represents a positive forecast, suggesting a long position, while a red represents a negative forecast, suggesting a short position.
Please note-for trading decisions use the most recent forecast. Get today’s forecast and Top stock picks.