
Bottom Up Stock Market Forecast for the main World Indices by using AI Powered Predictive Algorithm
Executive Summary
In this stock market forecast evaluation report, we introduced new bottom up signal generation methods using the I Know First AI Algorithm for the following world indices: S&P 500, DAX and CAC40. We compare the new bottom up signals’ performance with the direct forecasts’ performance generated for the indices using our short term model (1 to 6 days) and daily model (3 days to 3 months). Our analysis covers the time period from April 2, 2019, to April 3, 2020.


Bottom Up Forecast Evaluation Highlights:
- Short term model showed higher hit ratio than the Daily model for the 3 days’ time horizon for all indices analyzed.
- S&P 500 predictions showed higher hit ratio for all time horizons and methods than DAX and CAC40.
- Every method has hit ratios higher than 55% for the index’s predictions using Daily Model.
The above results were obtained based on forecasts’ evaluation over the specific time period.
About the I Know First Algorithm
The I Know First self-learning algorithm analyzes, models, and predicts the stock market. The algorithm is based on Artificial Intelligence (AI) and Machine Learning (ML) and incorporates elements of Artificial Neural Networks and Genetic Algorithms.
The system outputs the predicted trend as a number, positive or negative, along with a wave chart that predicts how the waves will overlap the trend. This helps the trader to decide which direction to trade, at what point to enter the trade, and when to exit. Since the model is 100% empirical, the results are based only on factual data, thereby avoiding any biases or emotions that may accompany human derived assumptions.
The human factor is only involved in building the mathematical framework and providing the initial set of inputs and outputs to the system. The algorithm produces stock market forecast with a signal and a predictability indicator. The signal is the number in the middle of the box. The predictability is the number at the bottom of the box. At the top, a specific asset is identified. This format is consistent across all predictions.
Our algorithm provides two independent indicators for each asset – Signal and Predictability.
The Signal is the predicted strength and direction of the movement of the asset. Measured from -inf to +inf.
The predictability indicates our confidence in that result. It is a Pearson correlation coefficient between past algorithmic performance and actual market movement. Measured from -1 to 1.
You can find a detailed description of our heatmap here.
Bottom Up Methods For World Indices
Every day our AI algorithm is generating stock market forecast for more than 13,500 assets around the world, including world indices, stocks, ETFs, commodities, currencies, and more.
The bottom up methodology consists in using the corresponding index’s components forecasts to generate a new independent signal which indicate the future direction of the index.
We have developed 3 different and independent methods:
Bottom Up Using Signal Values (BU signal values):
For this method we use all the components’ forecast signals generated by our AI algorithm. These signals are averaged by the corresponding weight of each index component.
For example, if an index is associated with 3 assets (A, B and C) weighted as shown in the table below and, the algorithm generated the following indicators for each asset. To get the index’s new signal we calculate a weighted average using their signal values as follows:


Bottom Up Using Signal Direction (BU signal direction):
This method consists in using all the components’ forecast signals direction generated by our AI algorithm. Instead of using the signal value as the previous method (BU signal values), we use only the direction of the forecast. So, if the signal is positive, we give that asset a signal value of 1, if it is negative, the signal value would be -1. These signals directions are averaged by the corresponding weight of each index component.
Using the same example as before. An index associated to 3 assets (A, B and C) with their forecast information below. To get the index new signal we calculate a weighted average using their signal direction.


Bottom Up Using Signal and Predictability (BU signal and pred):
For this method we use all the components’ forecasts generated by our AI algorithm, considering the predictability of each individual forecast. The constituents’ forecasts are sorted by predictability as shown in the table below. Then, we consider the signal values of the components until 60% of the index is covered (adding the weights of the components). These signals are averaged by the corresponding weight of each index component.
Same example as before, an index is associated to 3 assets (A, B and C) weighted as shown in the table below and with their forecast information. We sorted by predictability and we consider the signals until we covered 60% of the index. In this case, we consider only assets C and A. Finally, to get the index new signal we calculate a weighted average using the signal values which are in green.


The Hit Ratio Method
The hit ratio helps us to identify the accuracy of our algorithm’s predictions.
We predict the direction of the movement of different indices. Our predictions are then compared against actual movements of these indices within the same time horizon.
The hit ratio is then calculated as follows:

For instance, a 90% hit ratio would imply that the algorithm correctly predicted the index movement 9 out of 10 predictions within this particular time frame.
Performance Evaluation – Overview
In this report, we conduct testing for the S&P 500, DAX and CAC40 applying bottom up methods using I Know First AI algorithmic stock market forecast. The period for evaluation and testing is from April 2nd, 2019 to April 3rd, 2020. During this period, we generated daily forecasts for time horizons spanning from 1 day to 3 months which we evaluate in this report.
Bottom up Stock Market Forecast Results for World Indices: Hit Ratio
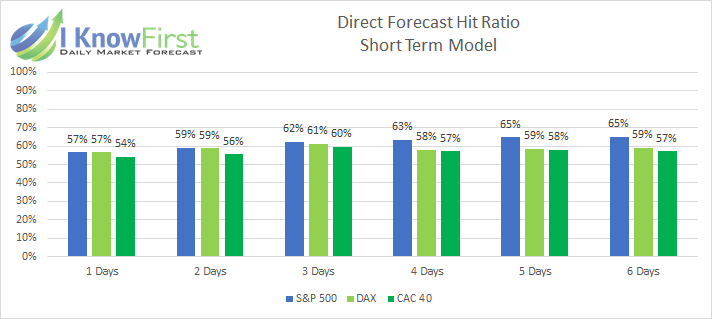
S&P 500 Index
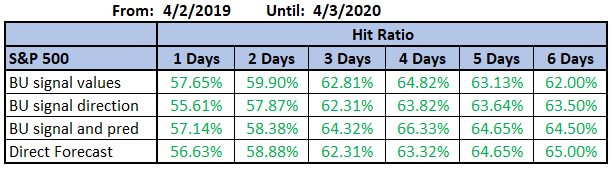

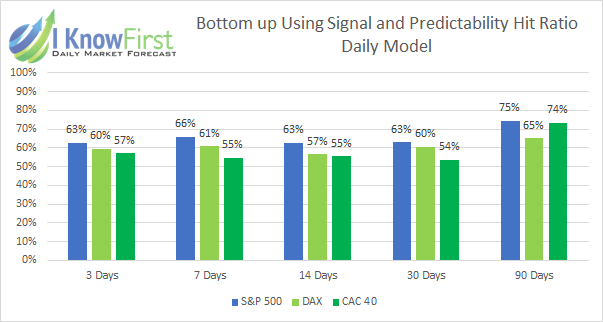
As can be seen in Table 4 and 5, our algorithm provided a hit ratio higher than 56% for S&P 500 predictions for all time horizons. The direct forecast, which refers to the forecasts generated by our AI algorithm for, in this case, the S&P 500 index, had a good performance over the period analyzed, reaching up to 74% hit ratio for the 90 days’ time horizon.
Bottom up methods showed improvement in terms of accuracy in most of time periods. The bottom up signal and predictability (BU signal and pred) had higher hit ratio than the direct forecasts for the 4 days’ time horizon achieving 66%, 3% more than direct forecasts hit ratio.
DAX Index


DAX index forecasts achieved hit ratios higher than 54% for all time horizons. The short term model (Table 6) reached up to 61% hit ratio for the 3 days’ time frame. The bottom up method showed to be effective for this model, improving most time frames. With the bottom up signal and predictability (BU singal and pred) the 3 days’ time frame predictions achieved 64% hit ratio.
For the Daily Model (Table 7) direct forecast were more effective than the bottom up methods, achieving the best performance with 64% hit ratio for the 30 days’ time horizon. As these 2 models (short term model and daily model) are predictions generated independently, we are able to compare the 3 days’ time frame. The short term model had higher hit ratio for the 3 days’ time horizon with 64% against 60% for the daily model using the bottom up signal and predictability method.
CAC 40 Index


The French stock market index (CAC 40) has hit ratios over 52%, reaching up to 59.6% for the 3 days’ time horizon in the short term model (table 8) and 73.5% for 90 days’ time horizon in the daily model (table 9). The bottom up method was more effective for the short term model, improving the hit ratio by 2% from the direct forecast for the 6 days’ time horizon.
The daily model showed hit ratios around 55% for 3 days to 30 days’ time horizons with direct forecast. With the bottom up methods, the hit ratios increased for 3, 7 and 14 days’ time horizons. Bottom up signal values was the most effective method for this index.
Conclusion
In this stock market forecast evaluation report, we introduced the new bottom up signal generation methods using the I Know First AI Algorithm forecasts for S&P 500, DAX and CAC40. We compare the new bottom up signals’ performance with the direct forecasts’ performance generated for the specific indices for the short term model and daily model, covering time horizons from 1 day to 3 months from April 2, 2019, to April 3, 2020.
The results of this analysis demonstrated that the bottom up methods can improve the predictions accuracy for the indices discussed. Indeed, the analysis demonstrates the efficacy of the AI algorithm forecasting these indices during a whole year, including pandemic times.
Comparing the bottom up methods, the Bottom up using signal values, which considers all the index components forecasts, was the most consistent one, improving most of the times the indices hit ratios.
We look forward to new market data in the following months and will monitor the changes in performance trends that are going to be communicated to our investors and subscribers in the follow-up reports.


