
Big Tech Stock Boom In The Pandemic: Predictions Reach Up To 99% Accuracy
Executive Summary
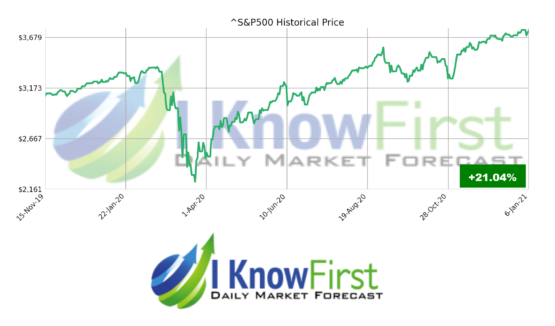
The purpose of this report is to present the results of the live forecast performance evaluation for the I Know First AI Algorithm, specifically for the Big Tech stocks. The following results were observed when signal and predictability filters were applied to pick the best-performing stocks out of the most predictable ones. The period under evaluation is from 15th November 2019 to 1st January 2021. The corresponding returns distribution of stock filters for the Big Tech stocks are shown below:


The Big Tech Stock Package Highlights:
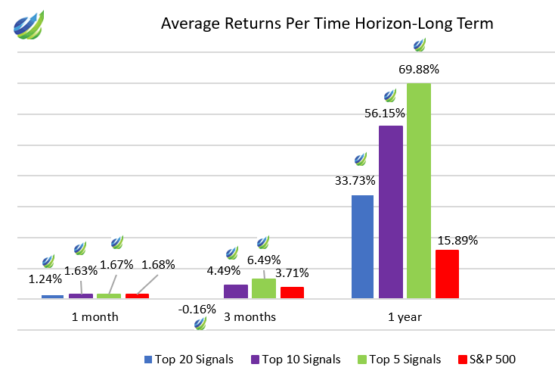
- The highest average return of 69.88 % is shown by the Top 5 Signals for 1-year long predictions
- Predictions reach up to 99% hit ratio regardless of economic conditions amid the pandemic in 2020
- For the 1-year time horizon, the Top 5 Signal group exponentially outperformed the benchmark index more than 4.4 times
Great Power Of Big Tech Stock: Weighs 27.8% In The S&P 500
By December 2020, the information technology sector of the S&P 500 was up 27.8% over the calendar year. 2020 has been one of the best years for tech stocks. It is not certain that tech companies will always crowd out the market this way, but the rapid digitization of shopping, work, and play that has erupted from the pandemic will continue to pay off for many tech names in 2021. Big Tech had contributed almost the entirety of the gains made by the S&P 500 stock market index (the figure below) during the year.
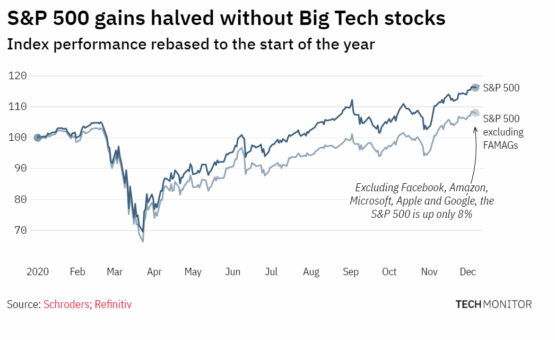
Over the past four years, the five tech titans’ revenues concerning the total S&P 500 have increased 42% and are projected to increase by more than one-fifth by 2023. While demand for products such as video conferencing services may decline after the pandemic era, large technologies are likely to perform well. These companies are rapidly embracing fourth revolution technologies such as 5G, AR / VR, and artificial intelligence.

(Source: techmonitor.ai)
About the I Know First Algorithm
The I Know First self-learning algorithm analyzes, models, and predicts the stock market. The algorithm is based on Artificial Intelligence (AI) and Machine Learning (ML) and incorporates elements of Artificial Neural Networks and Genetic Algorithms.

The system outputs the predicted trend as a number, positive or negative, along with a wave chart that predicts how the waves will overlap the trend. This helps the trader to decide which direction to trade, at what point to enter the trade, and when to exit. Since the model is 100% empirical, the results are based only on factual data, thereby avoiding any biases or emotions that may accompany human derived assumptions.
The human factor is only involved in building the mathematical framework and providing the initial set of inputs and outputs to the system. The algorithm produces a forecast with a signal and a predictability indicator. The signal is the number in the middle of the box. The predictability is the number at the bottom of the box. At the top, a specific asset is identified. This format is consistent across all predictions.
Our algorithm provides two independent indicators for each asset – Signal and Predictability.
The Signal is the predicted strength and direction of the movement of the asset. Measured from -inf to +inf.
The predictability indicates our confidence in that result. It is a Pearson correlation coefficient between past algorithmic performance and actual market movement. Measured from -1 to 1.
You can find a detailed description of our heatmap here.
The Stock Market Forecast Performance Evaluation Method
We perform evaluations on the individual forecast level. It means that we calculate what would be the return of each forecast we have issued for each horizon in the testing period. Then, we take the average of those results by strategy and forecast horizon.
For example, to evaluate the performance of our 1-month forecasts, we calculate the return of each trade by using this formula:

This simulates a client purchasing the asset based on our prediction and selling it exactly 1 month in the future.
We iterate this calculation for all trading days in the analyzed period and average the results.
Note that this evaluation does not take a set portfolio and follow it. This is a different evaluation method at the individual forecast level.
The Hit Ratio Method
The hit ratio helps us to identify the accuracy of our algorithm’s predictions.
Using our Daily Forecast asset filtering, we predict the direction of the movement of different assets. Our predictions are then compared against actual movements of these assets within the same time horizon.
The hit ratio is then calculated as follows:

For instance, a 90% hit ratio for a predictability filter with a top 10 signal filter would imply that the algorithm correctly predicted the price movements of 9 out of 10 assets within this particular set of assets.
The Benchmarking Method – S&P 500 Index
In order to evaluate our algorithm’s performance in comparison to the US market, we used the S&P 500 index as a benchmark.
The S&P 500 measures the stock performance of the largest 500 companies by market cap listed on different stock exchanges in the United States. It is one of the most followed equity indices and is frequently used as the best indicator for the overall performance of US public companies, and the US market as a whole. S&P 500 is a capitalization-weighted index, the weight of each company in the index is determined based on its market cap divided by the aggregate market cap of all the S&P 500 companies.
For each time horizon, we compare the S&P 500 performance with the performance of our forecasts.
Evaluating The Signal Indicator For The Big Tech Stock
In this section, we will demonstrate how our stock-picking method can improve if we add the signal indicators.

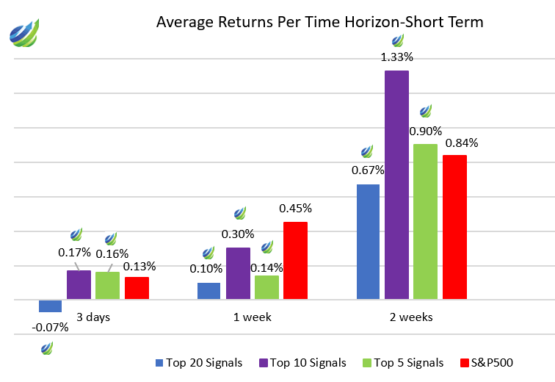
We can see from the above table that the returns increase when signal filtering is applied to narrow down the stocks subset – this occurs across all horizons ranging from 3 days to 1 year. We can also see a significant jump in the returns when the time horizon hits 1 year. The algorithm showed an incredibly high hit ratio of 99% over the 1-year time horizon with the highest average return of 69.88% for Top 5 Signals. There is a high average return of 33.73% and 56.15% for the Top 20 and the Top 10 Signals, respectively, for a 1-year time horizon.
For most of the signal groups, we see that the S&P 500 was outperformed. For the 1-year time horizon, the Top 5 Signal group exponentially outperformed the benchmark index more than 4.4 times.
Hit Ratio Per Time Horizon Analysis
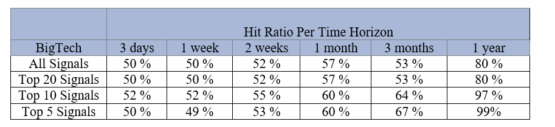
From Table 2, we can conclude that the most effective offer for an investor is a 1-year time horizon with the highest hit ratio. From above, we see that the hit ratio is 99% for the Top 5 Signals with an average return of 69.88%. For the Top 10 Signals, the average return is 56.15% with a hit ratio of 97%. For the Top 20 Signals, the average return is 33.73% with an 80% hit ratio. Even though the hit ratio decreases in the time horizon of 1 week and 3 months for the Top 5 Signals and the Top 20 Signals, the accuracy of our algorithm’s predictions starts from 50% and higher.

As shown above, I Know First’s algorithm predicted high results of average return and hit ratio, exceeding the benchmarks for the longest time horizon, despite the difficult conditions of 2020. The longest time horizon considerably outperforms the S&P 500, has a hit ratio of 80% and above. It can be concluded that the highest average return option for an investor will be the whole top Signals with a period of 1 year.
Conclusion
This evaluation report presented the performance of I Know First’s algorithm for the Big Tech stocks from 15th November 2019 to 1st January 2021. The algorithm is outperforming the benchmark index throughout the longest time horizon with the highest average return and hit ratio. The I Know First algorithm performed with the incredible hit ratio of 99% for the Top 5 Signals, with an average return of 69.88%. Many Big Tech stocks will continue to outperform the market. They have not only survived but thrived during the pandemic. Over the past four years, the five tech titans’ revenues concerning the total S&P 500 have increased 42% and are projected to increase by more than one-fifth by 2023. It could pay well to add a few of Big Tech stocks to the portfolio as long-term investments considering the I Know First predictability indicator. There are big opportunities with high growth potential.


