
Low PE Stocks: AI Stock Predictions Beat S&P 500 4 Times Amid COVID-19
Executive Summary
The purpose of the Low PE Stocks report is to present the results of the live forecast performance evaluation for the I Know First AI Algorithm, specifically for Low PE stock. The following results were observed when signal and predictability filters were applied to pick the best-performing stocks out of the most predictable ones. The period under evaluation is from 17th May 2019 to 1st January 2021. The corresponding returns distribution of stock filters for the Low PE are shown below:


The Low PE Stock Package Highlights:
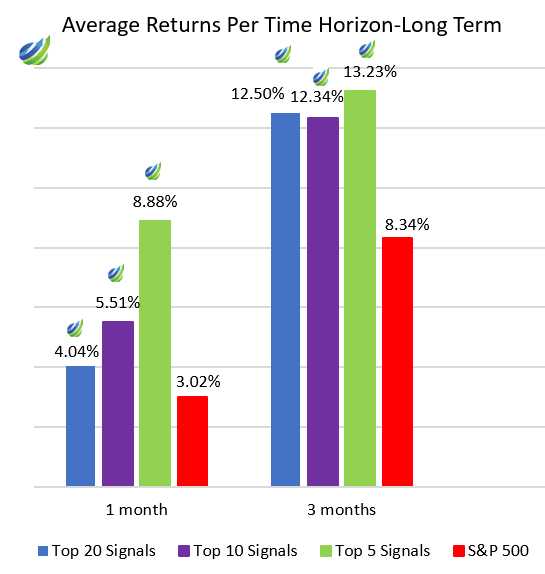
- 13.23 % – the highest average return for an investor in the Top 5 Signals with a period of 3-months
- Predictions reach up to 57% hit ratio regardless of economic conditions amid COVID-19
- The Top 5 Signals group outperformed the S&P 500 by 4.6 times for the 2 weeks time horizon
Low PE Stock Amid COVID-19
Usually, when evaluating a stock as a potential investment, it is best to start with a P/E ratio. Under “normal” economic conditions, you can expect a healthy company to increase profits every year. This means that the company’s rolling P/E ratio (covering the previous 12 months) will be higher than its forward P/E ratio (which uses its earnings forecast to predict the future earnings-to-current share price). However, 2020 has been a major disruption in the economy in the form of the coronavirus pandemic. The blockages and lockdowns caused by the COVID-19 outbreak put many companies’ on the brink of survival, which negatively reflected on the current stock prices, and therefore on the moving P/E ratio.
S&P 500 Earnings Per Share is currently at $32.98, up from $17.83 last quarter and down from $33.99 one year ago – a change of 84.97% and -2.97%, respectively. 92% of S&P 500 companies reported 3Q results, 84% of S&P 500 companies have reported positive earnings per share and 78% have reported a positive revenue.
Profit for the third quarter was down by 7.5% and is not forecasted to return to growth until the first quarter of 2021. This is still a dramatic expectations improvement from 6 months ago. Among the 63 companies that presented 4Q forecasts, 70% gave a positive forecast. Unsurprisingly, the energy sector was hit the hardest last year, as shown in the figure below.

The current 10-year P/E ratio for the S&P 500 is 33.91. As of January 2021, this is 71% above the market average of 19.6, which means the current P/E ratio is more than 1 standard deviation higher than the current average and indicates that the market is overvalued. Nevertheless, when accounting for the low-interest rate, S&P 500 valuations are not that higher as it seems to be. Taking risk in the S&P 500 stock market is compensating in line with historical norms.
About the I Know First Algorithm
The I Know First self-learning algorithm analyzes, models, and predicts the stock market. The algorithm is based on Artificial Intelligence (AI) and Machine Learning (ML) and incorporates elements of Artificial Neural Networks and Genetic Algorithms.

The system outputs the predicted trend as a number, positive or negative, along with a wave chart that predicts how the waves will overlap the trend. This helps the trader to decide which direction to trade, at what point to enter the trade, and when to exit. Since the model is 100% empirical, the results are based only on factual data, thereby avoiding any biases or emotions that may accompany human derived assumptions.
The human factor is only involved in building the mathematical framework and providing the initial set of inputs and outputs to the system. The algorithm produces a forecast with a signal and a predictability indicator. The signal is the number in the middle of the box. The predictability is the number at the bottom of the box. At the top, a specific asset is identified. This format is consistent across all predictions.
Our algorithm provides two independent indicators for each asset – Signal and Predictability.
The Signal is the predicted strength and direction of the movement of the asset. Measured from -inf to +inf.
The predictability indicates our confidence in that result. It is a Pearson correlation coefficient between past algorithmic performance and actual market movement. Measured from -1 to 1.
You can find a detailed description of our heatmap here.
The Stock Market Forecast Performance Evaluation Method
We perform evaluations on the individual forecast level. It means that we calculate what would be the return of each forecast we have issued for each horizon in the testing period. Then, we take the average of those results by strategy and forecast horizon.
For example, to evaluate the performance of our 1-month forecasts, we calculate the return of each trade by using this formula:

This simulates a client purchasing the asset based on our prediction and selling it exactly 1 month in the future.
We iterate this calculation for all trading days in the analyzed period and average the results.
Note that this evaluation does not take a set portfolio and follow it. This is a different evaluation method at the individual forecast level.
The Hit Ratio Method
The hit ratio helps us to identify the accuracy of our algorithm’s predictions.
Using our Daily Forecast asset filtering, we predict the direction of the movement of different assets. Our predictions are then compared against actual movements of these assets within the same time horizon.
The hit ratio is then calculated as follows:

For instance, a 90% hit ratio for a predictability filter with a top 10 signal filter would imply that the algorithm correctly predicted the price movements of 9 out of 10 assets within this particular set of assets.
The Benchmarking Method – S&P 500 Index
In order to evaluate our algorithm’s performance in comparison to the US market, we used the S&P 500 index as a benchmark.
The S&P 500 measures the stock performance of the largest 500 companies by market cap listed on different stock exchanges in the United States. It is one of the most followed equity indices and is frequently used as the best indicator for the overall performance of US public companies, and the US market as a whole. S&P 500 is a capitalization-weighted index, the weight of each company in the index is determined based on its market cap divided by the aggregate market cap of all the S&P 500 companies.
For each time horizon, we compare the S&P 500 performance with the performance of our forecasts.
Evaluating The Signal Indicator For Low PE Stock
In this section, we will demonstrate how our stock-picking method can improve if we use filtering by signal indicators.

Considering Table 1, we can see that the returns increase when signal filtering is applied. Every signal group for every time horizon outperformed the S&P 500. For the 2-weeks time horizon, the Top 5 Signals group exponentially outperformed the benchmark index more than 4.6 times. That group had a return of 7.34% in comparison to the S&P 500’s return of 1.59%. Besides, we can observe the highest average return by 13.23% of the Top 5 Signals for a 3-month time horizon. The hit ratio reaches up to 57% precision regardless of market volatility. The algorithm shows an amazingly high hit ratio of 50% in the shortest period of time for the Top 20 Signals with an average return of 0.75%.


Hit Ratio Analysis

Regarding Table 2, we can conclude that the highest hit ratio is 57% for the shortest time horizon – 2-weeks for the Top 5 Signals. The Top 10 Signals’ highest hit ratio falls on the 2-weeks and 1-month time horizons – both 54%. The lowest hit ratio of 50% for the Top 20 Signals falls on the shortest time horizon – 3-days and increases with each time interval up to the longest up to 55%. Consequently, we can see that using P/E is not always straightforward. Nevertheless, the I Know First algorithmic forecast showed over 50% accuracy, a positive average return, and exceeded the benchmark. Altogether, it can be concluded that the highest average return of 13.23% with a hit ratio of 53% for an investor will be the Top 5 Signals with a period of 3-months.

Using the P/E ratio to evaluate investments in 2020 was very risky due to the coronavirus’s impact. Nevertheless, on all the above time horizons, I Know First predictions considerably outperform the S&P 500, which has an accuracy above 50%. This is significant because, in addition to having tremendous returns on a long horizon, I Know First’s algorithm has demonstrated consistency for positive gains in short time frames.
Conclusion
This evaluation report presented the performance of I Know First’s algorithm for the Low PE stock from 17th May 2019 to 1st January 2021. The algorithm is outperforming the benchmark index throughout the time periods. If you are interested in short-term investment, the Top 5 Signals is a suitable option on a 2 weeks time horizon with an average return of 7.34% and a hit ratio of 57%. It is worth considering the Top 5 Signals for a 1-month time horizon with an average return of 8.88% and a hit ratio of 56% and Top 20 Signals for a 3-month time horizon with an average return of 12.50% and a hit ratio of 55% for long-term investments. Given the severe turmoil in the economy due to the coronavirus pandemic, reflected in current stock prices and rolling P/E ratio, the I Know First AI-powered forecasting algorithm performed well. Definitely, investors can improve their investments by adding Low PE stocks to their portfolios by using the I Know First predictability indicator and signal values.


