
Top S&P 500 Stocks Performance Report By Day Of The Week By I Know First Evaluation
Executive Summary
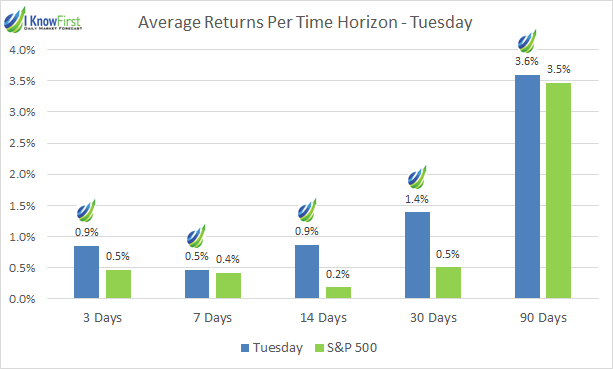
Is there a best day to start trading with I Know First AI signals? The purpose of this report is answer this question presenting the results of our live forecast performance evaluation for I Know First AI Algorithm, specifically for S&P 500 Stocks. The following results were observed when signal and predictability filters were applied, picking the top 5 signals out of the 30 most predictable ones. Also, the results were filtered by the day of the week the forecasts were generated and compared with the S&P 500. The period under evaluation is from January 1st, 2019 to April 1st, 2020. The corresponding returns distribution for S&P 500 stocks by day of the week are shown below:


S&P 500 Stocks Package Highlights:
- No matter the day and the time horizon, the average return of the I Know First Algorithm is always positive.
- There is a clear increasing trend for returns improvement with the time horizon.
- Monday and Wednesday had higher returns on the short-term horizons on average.
- The algorithm results consistently outperform the S&P 500 in every condition.
The above results were obtained based on forecasts’ evaluation over the specific time period using a consecutive filtering approach – by predictability, then by signal, to give an overview of the forecasting capabilities of the algorithm for the specific stock universe.
About the I Know First Algorithm

The I Know First self-learning algorithm analyzes, models, and predicts the stock market. The algorithm is based on Artificial Intelligence (AI) and Machine Learning (ML) and incorporates elements of Artificial Neural Networks and Genetic Algorithms.
The system outputs the predicted trend as a number, positive or negative, along with a wave chart that predicts how the waves will overlap the trend. This helps the trader to decide which direction to trade, at what point to enter the trade, and when to exit. Since the model is 100% empirical, the results are based only on factual data, thereby avoiding any biases or emotions that may accompany human derived assumptions.
The human factor is only involved in building the mathematical framework and providing the initial set of inputs and outputs to the system. The algorithm produces a forecast with a signal and a predictability indicator. The signal is the number in the middle of the box. The predictability is the number at the bottom of the box. At the top, a specific asset is identified. This format is consistent across all predictions.
Our algorithm provides two independent indicators for each asset – Signal and Predictability.
The Signal is the predicted strength and direction of the movement of the asset. Measured from -inf to +inf.
The predictability indicates our confidence in that result. It is a Pearson correlation coefficient between past algorithmic performance and actual market movement. Measured from -1 to 1.
You can find a detailed description of our heatmap here.
The Stock Picking Method
The method in this evaluation is as follows:
We take the top 30 most predictable assets and, from them, we pick the top 5 highest signals.
By doing so we focus on the most predictable assets on the one hand, while capturing the ones with the highest signal on the other.
For example, a top 30 predictability filter with a top 5 signal filter means that on each day we take only the 30 most predictable assets, and then we pick from them the top 5 assets with the highest absolute signals.
We use absolute signals since these strategies are long and short ones. If the signal is positive, then we buy and, if negative, we short.
The Stock Market Forecast Performance Evaluation Method
We perform evaluations on the individual forecast level. It means that we calculate what would be the return of each forecast we have issued for each horizon in the testing period. Then, we take the average of those results by strategy and forecast horizon.
For example, to evaluate the performance of our 1-month forecasts, we calculate the return of each trade by using this formula:

This simulates a client purchasing the asset based on our prediction and selling it exactly 1 month in the future.
We iterate this calculation for all trading days in the analyzed period and average the results.
Note that this evaluation does not take a set portfolio and follow it. This is a different evaluation method at the individual forecast level.
The Hit Ratio Method
The hit ratio helps us to identify the accuracy of our algorithm’s predictions.
Using our asset filtering, we predict the direction of the movement of different assets. Our predictions are then compared against actual movements of these assets within the same time horizon.
The hit ratio is then calculated as follows:

For instance, a 80% hit ratio for a top 30 predictability filter with a top 5 signal filter would imply that the algorithm correctly predicted the price movements of 4 out of 5 assets within this particular set of assets.
The Benchmarking Method – S&P 500 Index
In order to evaluate our algorithm’s performance in comparison to the US market, we used the S&P 500 as a benchmark.
The S&P 500 measures the stock performance of the largest 500 companies by market cap listed on different stock exchanges in the United States. It is one of the most followed equity indices and is frequently used as the best indicator for the overall performance of US public companies, and the US market as a whole. S&P 500 is a capitalization-weighted index, the weight of each company in the index is determined based on its market cap divided by the aggregate market cap of all the S&P 500 companies.
For each time horizon, we compare the S&P 500 performance with the performance of our forecasts.
Stock Universe Under Consideration – S&P 500 Stock Market
In this report, we conduct testing for S&P 500 stocks that I Know First cover by its algorithmic forecast in the package. The period for evaluation and testing is from January 1st, 2019 to April 1st, 2020. During this period, we were providing our clients with daily forecasts for S&P 500 stocks and the time horizons which we evaluate in this report are 6 periods spanning from 3 days to 1 year.
Evaluating the Signal Indicator for S&P 500 Stocks
In this section, we will demonstrate how our stock-picking method is generating good results every day of the week.

Considering Table 1, we can see that the algorithm generated positive results no matter the day of the week the forecast was generated. In all of them, the algorithm consistently outperformed the benchmark, providing better results in all time horizons. The outperformance is more evident in the short-term, where all the returns were higher than the S&P 500 in the same conditions.
When we compare the days of the week, as shown from Figure 1 to 5, it is possible to observe that Tuesday and Friday produce the best results in the long-term, while Monday and Wednesday had better returns on the short-term on average.
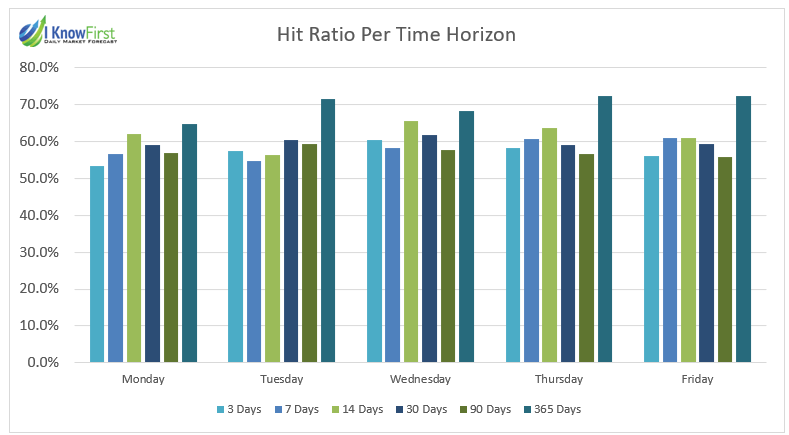
From Figure 6, we can observe that the hit ratio was high in all circumstances. In all categories, the hit ratio was higher than 53%, increasing to over 64% in the 365 Days time horizon. Wednesday and Thursday produced the best hit ratios on average.
Conclusion
This analysis represents the outperformance of the forecasts generated by the I Know First algorithm for S&P 500 Stocks by day of the week from January 1st, 2019 to April 1st, 2020. The evaluation was made comparing the average returns per time horizon and the hit ratio per time horizon between the algorithm results and the S&P 500, the benchmark, by the day of the week the predictions were generated.
When we apply the predictability and signal filters, we can observe results with better performance than the benchmark. The results generated by the algorithm consistently outperformed the S&P 500, comparing different time horizons and day of the week. By the hit ratio perspective, the percentage was higher than 50% in all circumstances, reaching over 64% in the 365 days forecast.
All in all, an investor can improve his investments by adding the S&P 500 stocks to his portfolio when considering the I Know First predictability and signal indicators.


